Resource Monitoring
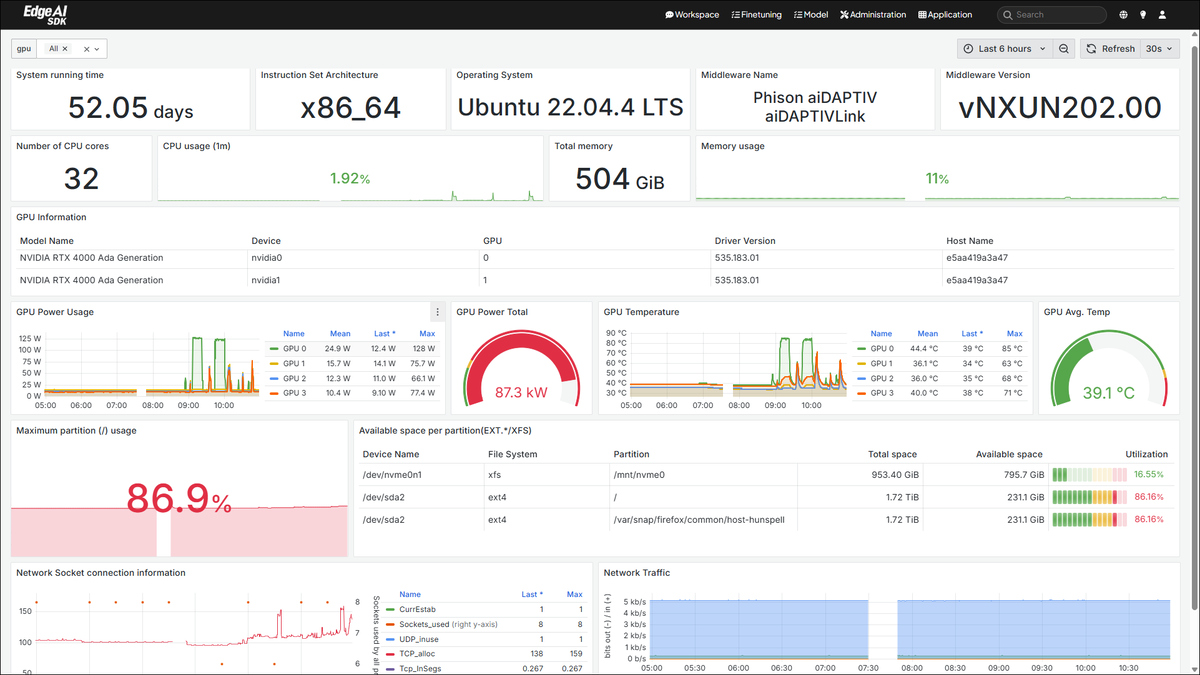
GenAI Studio integrates Grafana and Prometheus to provide comprehensive, real-time, and historical monitoring of system performance, with a strong emphasis on GPU-specific metrics. This integration allows for:
-
Real-Time Monitoring: The system continuously collects and tracks key performance indicators (KPIs) across various system components. This includes traditional metrics like CPU usage, memory utilization, disk I/O, and network activity.
-
Historical Data Analysis: Prometheus stores time-series data, enabling in-depth analysis of past performance trends, identification of bottlenecks, and capacity planning.
-
GPU-Focused Metrics: In addition to standard system metrics, the solution gathers and visualizes critical GPU metrics. These metrics may include:
- GPU utilization (%)
- GPU memory usage (total, used, and free)
- GPU temperature
- GPU power consumption
- GPU clock speeds (core and memory)
- GPU compute unit/core utilization
- Specific metrics related to GPU workloads (e.g., frame rates in graphics applications, tensor core usage in machine learning).
Benefits
Proactive Issue Detection: By monitoring system and GPU metrics in real-time, potential problems can be identified and addressed before they lead to performance degradation or system failures.
Performance Optimization: Historical data analysis helps identify performance bottlenecks and areas for optimization, leading to more efficient resource utilization.
Resource Management: The system provides insights into resource usage patterns, enabling better capacity planning and allocation of resources.
Improved Reliability: Early detection of issues and proactive intervention contribute to increased system reliability and uptime.
Enhanced Visibility: Customizable dashboards provide a clear and comprehensive view of system and GPU performance, facilitating better understanding and decision-making.